Reports shows revenue, orders, traffic, and per-product performance for a date range you select.
Open Reports
- Go to Dashboard then Reports.
Choose the period
-
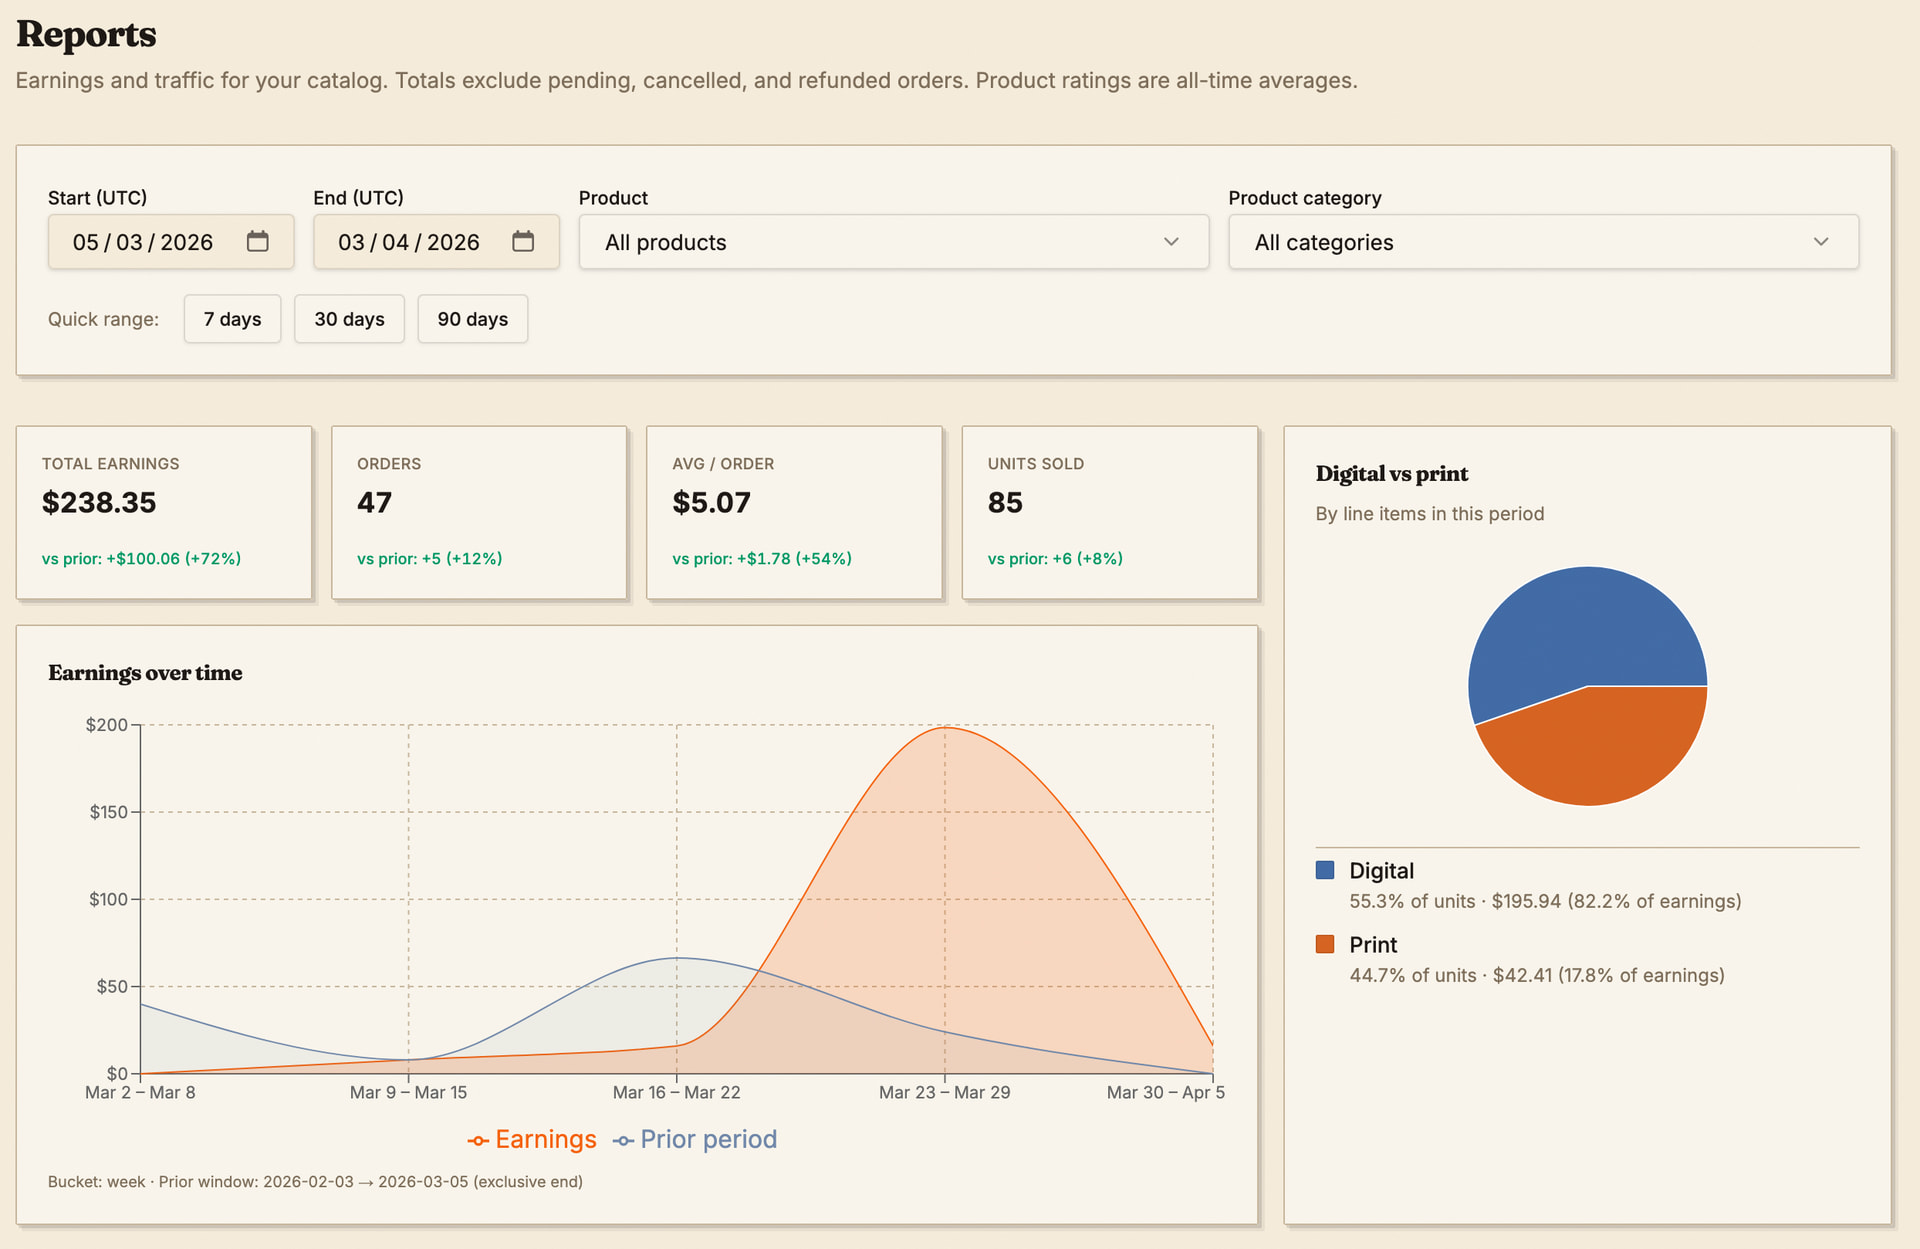
Set the date range filters at the top.
-
Add other filters the page offers (for example a specific product or category).
Read the summary
-
KPI cards compare the current range to the prior period when that data exists.
-
Charts show earnings over time and splits such as digital versus print.
Traffic sources
-
See product page views by referrer type.
-
Expand Top referrer hosts when the section appears.
Product performance table
-
Sort by product title, views, units, orders, conversion, earnings, or average rating.
-
Expand a row to see per-tier breakdown when available.
-
Use the search box to filter the table by title on the client.
Export CSV
-
Click CSV above the product performance table.
-
Open the file in a spreadsheet app for review and analysis.